Practitioner-facing technology
Scope
A practitioner-facing tool is aimed at the worker rather than the client: documentation, scheduling, decision support, supervision, referral, and monitoring. In the World Health Organization’s classification of digital health interventions this is the second of four audiences, and it covers what an organization buys for itself.
Almost none of it is generative AI. Case management systems, electronic records, scheduling software, electronic referral platforms, mandated verification systems, and dashboards account for most of what a caseworker touches in a day. The companion page covers client-facing technology.
Claims
A tool bought for staff is sold on four arguments: that it returns time lost to paperwork, that the returned time becomes client contact, that it lowers burnout, and that it helps the agency retain people. Measurements of time run underneath all four, as does the fact that the same tool can serve support or surveillance depending on who controls it.
A fifth claim supports those four and is rarely stated: that the worker sees any of the efficiency gain at all.
Two of the field’s most-quoted numbers cannot be verified against a source, and both are in the sections below with the check attached.
Evidence
Documentation time
Documentation load is what most practitioner-facing tools claim to solve. In the federal workforce study, child welfare caseworkers report spending a mean of 4.3 hours of an 8-hour workday on paperwork and documentation, with more than half reporting burnout and nearly half elevated secondary traumatic stress. The clinical analog is physicians spending 5.9 of an 11.4-hour day in the electronic record, 44 percent of that time on clerical work.
Before quoting a figure at a partner, check which kind it is. The number that circulates most, that caseworkers spend 50 to 80 percent of their time on paperwork, comes from a 2003 GAO report whose own sentence reads that caseworkers and supervisors in four states “told us” so, “with some estimating between 50 percent and 80 percent”. No time study produced it. Where the time has been observed rather than recalled, it is much lower: a 2023 North Carolina workload study using random moment sampling across 100 counties put case documentation at 14.8 percent of caseworker time, still the single largest activity; a four-week Colorado study of about 1,300 workers in 54 counties put documentation and administration together at 38 percent; and a one-week time-diary study of 1,153 English social workers recorded 26 percent on direct client contact and 22 percent on case recording. The British version of the headline, 60 to 80 percent, originates in a newspaper article and a commentary.
These are self-reported hours. The observational studies sample what workers are doing at a given moment instead of asking them to recall a day, which is a different measurement, and they return much lower shares.
The mean also hides the spread, and the spread is where a pitch has to aim. The same table reports the distribution: about a quarter of caseworkers spend one to three hours a day on documentation, and nearly a fifth spend six to eight of their eight hours on it.
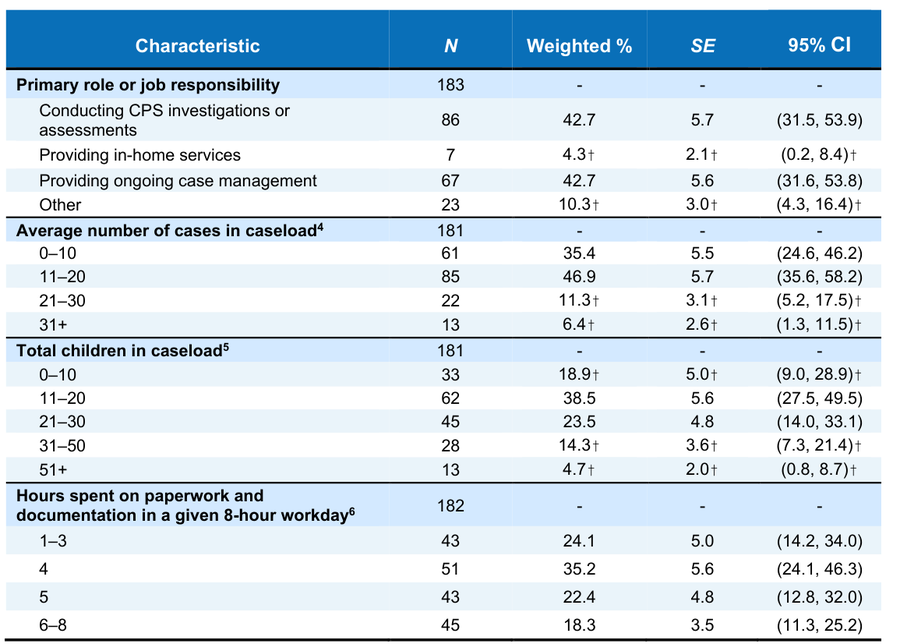
Documentation time after a new system
The direction is not guaranteed. Pooling 28 time-motion studies with at least 40 hours of observation each, documentation rose as a share of workload after electronic records went live, from 16 to 28 percent for physicians and from 9 to 23 percent for nurses. An earlier review of 23 papers found the sign flipping by occupation and interface: bedside terminals cut nurse documentation time by 24.5 percent while increasing physician documentation time by 17.5 percent, and its authors concluded that a project promising less documentation time is unlikely to deliver it.
The one comparison from a social impact setting is weaker still. In the English diary study above, the 846 workers using an electronic recording system spent 23 percent of their time on case recording against 18 percent for the 169 who did not, with direct contact flat at 26 against 25 percent. The report is cross-sectional, the non-user group is small and skewed to the voluntary sector, and its authors ask for further investigation rather than claiming an effect.
A badly built system produces a second system. In a court-ordered independent assessment of Michigan’s child welfare information system, 72 percent of provider agencies reported keeping another record in addition to it because of concerns about reliability, and 48 percent of 1,634 state users said it harmed timely documentation.
Recovered time
Organizations adopting these systems expect time saved on documentation to return as time with clients. That conversion is almost never measured. In the one study located that measured both sides in the same design, 26 nurses across two wards cut documentation from 12.35 to 8.25 minutes per hour after a new record system, which was significant at P equals 0.003, while patient interaction rose from 7.84 to 9.30 minutes per hour, which was not significant at P equals 0.25. Fragmentation did change significantly, with uninterrupted interaction episodes lengthening by 163 percent.
Virginia gave about 2,000 staff across 120 local departments dictation software and tablets and evaluated it with an interrupted time series; overdue documentation fell by a third to a half and roughly a thousand more contacts were documented on time each month. The one outcome measured administratively was documentation timeliness, and the increase in client contact time is self-report, from 55 percent of 422 surveyed caseworkers.
Usability and burnout
The association between record-system burden and burnout is consistent across reviews and thin underneath. A 2024 pooled analysis of 37 studies and 66,556 participants found burnout prevalence of 40.4 percent and an odds ratio of 2.43 (95% CI 2.31 to 2.57) for time in the record outside work hours; a 2026 review of 41 studies and 54,443 participants pooled an odds ratio of 2.49 (95% CI 1.82 to 3.41), falling to 1.98 (95% CI 1.40 to 2.80) once outliers were excluded. Every one of those 41 studies was cross-sectional.
Burnout itself is measured inconsistently: a review of 182 studies covering 109,628 physicians found at least 142 distinct definitions and prevalence estimates ranging from 0 to 80.5 percent, and declined to pool. Documentation burden is measured worse: across 135 articles, adequate content validity evidence appeared in about 11 percent. Self-report is also unreliable in a known direction, since in one paired study clinicians overestimated their daily time in the system by 4.76 hours against the audit logs. None of this makes the association false. It makes “our system causes burnout” and “this product will fix it” claims that the evidence cannot currently support.
Turnover
Turnover rates in this field are usually quoted from administrator estimates. Where they have been measured against records, they are lower and narrower: a study of 139,921 caseworkers across 46 states put median annual state turnover between 14 and 22 percent, and in substance use treatment, 27 organizations checked against their own personnel records gave 33.2 percent for counselors, against prior field estimates spanning 19 to 50 percent that had never been checked that way.
The premise underneath the pitch has been tested directly, and it does not hold. In a nationally representative study, supervisors who reported turnover had increased named their top three reasons from a list of sixteen: job stress and worker burnout at 74.9 percent, better pay elsewhere at 44.6 percent, workload at 41.3 percent, and paperwork at 7.3 percent, the lowest of the reportable options.
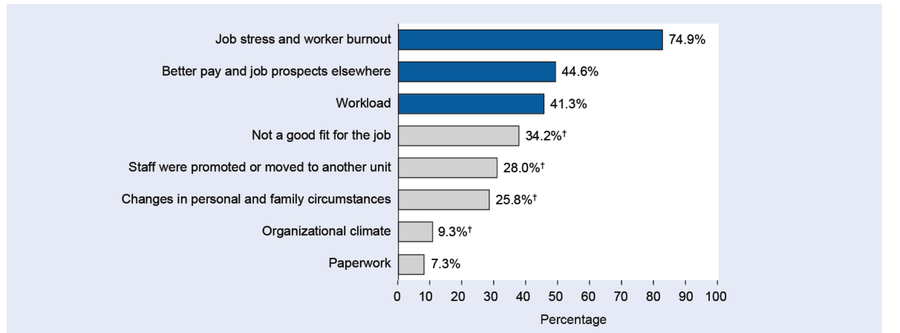
The deployment evidence agrees with that ranking. The Virginia evaluation above states that its data suggest the intervention did not affect turnover, even though documentation timeliness improved and 62 percent of workers said the tools lowered their stress. A cluster-randomized trial of telework across 50 child welfare offices found that it did not lower the likelihood of turnover and produced no differences in satisfaction, intentions, stress, or burnout, while interviews with 97 staff reported the opposite impression, so perception and measurement came apart inside a single study.
One study tracked real departures rather than stated intentions. Following 314 ambulatory physicians across 141 sites for two years, less time in the record predicted leaving, not more: inbox time had an odds ratio of 0.78 (95% CI 0.68 to 0.90), with documentation time null. The plausible reading is that people who are on their way out disengage from the system first. Studies that measure intent to leave show the opposite: poorer record usability among 12,004 nurses in 343 hospitals had an odds ratio of 1.31 (95% CI 1.09 to 1.58) for intention to leave. Intending to leave and leaving are different outcomes, and a pitch that cites the first as if it were the second is overclaiming.
Referral platforms
Closed-loop referral platforms promise that a referral can be followed to a service. Volume rises reliably; closure does not. A systematic review of electronic community resource referral systems found that of 41 studies, only six described a system that confirmed whether the client made contact or received the service. In the federal Accountable Health Communities randomized evaluation, navigation did not significantly raise the rate of connection to a community provider or the rate of need resolution, with transportation, ineligibility, and wait-lists named as the reasons. An emergency department that screened 2,821 patients over 412 days found that 7 percent completed the whole path from screening to a community referral.
Contracting changes the picture, which locates the problem outside the software: a health plan that paid and contracted 37 community organizations recorded loop closure of 85 percent against 24 percent for non-contracted referrals, with service receipt at 27 against 17 percent. The reporting burden is heaviest on the organizations least able to absorb it. In interviews across six Kentucky Medicaid plans and 19 community organizations, one described an $8,000 annual contract whose data requirements a small housing provider could not meet, and another declined data sharing entirely, since not asking for identification is why its clients come at all.
Cost, delay, and failure
Two numbers belong in any pitch. First, running a system costs more than building it: across fiscal 2008 to 2018, states spent $10.37 billion on designing and installing Medicaid management systems and $22.29 billion operating and maintaining them. Second, the base rate. Across 5,392 information technology projects in 66 countries, the mean cost overrun ratio was 1.8 with a median of 1.0 and a maximum of 280, meaning most projects finish near their estimate while a long tail does not, and public sector projects do worse than private ones. The study excludes maintenance and terminated projects, so it flatters the field.
Child welfare has its own record. A 2003 review of statewide systems found a median delay of two and a half years past states’ own timelines, and in one state 65 percent of the records checked in a federal assessment recorded a child’s removal date as the day the system went live, with actual removals ranging across nine years. Two decades later, of 75 projects under the successor regulation, 23 were fully operational, 10 percent among new builds, and 75 percent were not fully operational after eight years.
Three named cases document failure at scale. Indiana contracted IBM to modernize its welfare eligibility system in 2006 and canceled it in under three years; after a decade of litigation the state Supreme Court held that IBM had materially breached the contract, and the final judgment was $128 million in damages against $49,510,795 in offsets, or $78,178,109 to the state. California’s replacement child welfare system was approved in 2013 for completion in 2017; its approved cost has run from a $392.7 million baseline in 2017 to $1.711 billion, with completion now set for late 2026. England’s National Programme for IT was an £11.4 billion program that had spent about £6.4 billion by March 2011, by which point the scope had been cut by around half in acute trusts and, in the auditors’ words, “savings achieved as a result of this reduction in scope have, however, been just £73 million out of £1,021 million”. Michigan’s MiDAS is a fourth, and it has an entry in the case bank.
None of these was a small vendor or an obscure agency. They have in common a fixed statutory deadline, a compliance definition of success, and no baseline against which a benefit could later be measured.
A system also shapes the numbers an agency reports to its funder. Auditors found that in all eight states they visited, consultants and state review committees used methods to resolve cases rather than report them as errors, so the federal food assistance error rate was understated. The count is decided by what the system asks for and what the funder rewards, which is A6 on the protocol: what arrangement does it reinforce, and how hard would that be to undo.
Distribution of the gain
Three studies measure what happened to the time a tool saved.
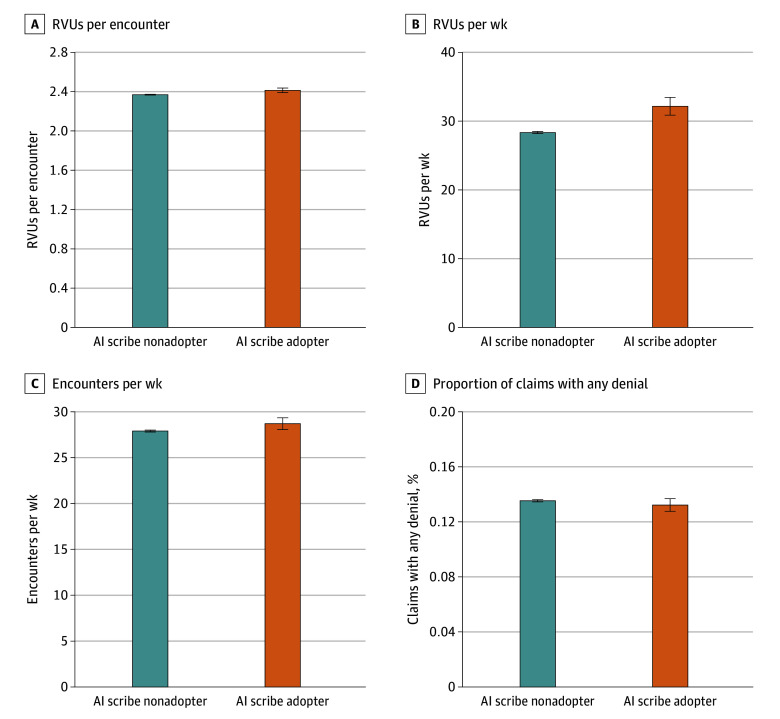
An academic health system tracked 1,202,734 ambulatory encounters by 1,565 physicians over two years as an ambient AI scribe was deployed. Compared with colleagues who had not adopted it, adopters recorded 0.80 more encounters per week (95% CI 0.05 to 1.56) and 1.81 more billed work units per week (95% CI 0.86 to 2.75), which the authors price at roughly $3,000 a year per physician. The authors state how it happened: “There were no additional productivity requirements for AI scribes, and results reflect physicians’ voluntary response.” No one raised a target, and the output rose anyway.
A national study measured where the saved time went. Linking two surveys of about 25,000 workers each to Danish administrative payroll records, Humlum and Vestergaard found average time savings of 2.8 percent of work hours, against gains above 15 percent in trials of the same occupations, and precise nulls on earnings and recorded hours. Of workers who saved time, 80 percent redirected it to other job tasks and fewer than 10 percent took additional breaks. The tools also made work: 12 percent of users reported new tasks created by the technology, rising to about 17 percent where the employer ran an active initiative, and 59 percent of those new tasks were oversight, quality review, and compliance rather than productive use. This is a working paper, and Denmark’s labor protections are not the United States’, so the null on hours should not be treated as a prediction here.
The closest reading of this question inside social impact settings arrives at the same place by reasoning rather than measurement. A 2025 scoping report for the English Department for Education on AI in case recording states that “the assumption that net time savings will translate to more face-to-face time with children and families may not materialise”, since social workers already average about 45 hours against contracted hours, and that “the social worker’s time shifts from inputting data to quality assuring the GenAI output.” It is a scoping exercise built on 18 interviews and two focus groups, with no time measured, and it should be presented that way.
Outside human services, one case documents an employer converting a tool’s gain directly into a higher requirement. A Senate committee investigation found that Amazon’s own internal analysis identified an upper limit of about 1,940 picks per ten-hour shift and estimated that holding to it would cut musculoskeletal injury risk by 19.1 percent, while workers actually averaged 2,398. Warehouse piece rates are not caseloads, and the report is majority staff work. It documents that the mechanism exists; it does not supply a rate that transfers.
Measured time against felt burden
Studies of AI documentation tools measure two different quantities that do not agree, and reported burden improves more reliably than the clock does.
Two studies of AI-drafted replies to patient messages make the split visible. A Stanford pilot found physician task load down 13.87 points on a 400-point scale (95% CI 17.38 to 9.50) while reply time, read time, and write time were all unchanged. A randomized study at UC San Diego with 70 contemporary controls found reply time not significantly changed and read time up 21.8 percent (95% CI 5.2 to 41.0). Citing the satisfaction figure from either without the time result misreports the study.
The evening is where the promise fails most consistently. A randomized crossover trial of two scribe products across 136 clinicians found burnout down about nine points on both, documentation down five to nine minutes a day, and after-hours work unchanged for both products, with both point estimates pointing the wrong way.
None of that makes the tools useless, and the better-designed trials find real effects. A three-arm randomized trial of 238 physicians found one product cut time in notes by 9.5 percent (95% CI 1.8 to 17.2) while the other produced no significant change, with both improving reported burnout. A stepped-wedge randomized trial of 66 practitioners found work exhaustion down 0.44 points on a five-point scale (95% CI 0.25 to 0.62) and about 22 minutes a day less in notes. In that trial the product decided the outcome and the category did not, so a vendor citing the general literature about scribes is citing something that does not establish anything about its own product.
Cognitive cost
The tool changes the work of thinking, and the measured effects are not all in the direction a buyer expects.
In a survey of 319 knowledge workers who use generative AI at work weekly, higher confidence in the tool predicted less reported critical thinking (β = −0.69, p < .001), while higher confidence in one’s own ability predicted more. Respondents reported reduced effort across every cognitive category, from 55 percent for evaluation to 79 percent for comprehension. The study measures perceived critical thinking, not measured, and six of its seven authors work for the company that sells the tool. One respondent named the mechanism this page is about: “in sales, I must reach a certain quota daily or risk losing my job. Ergo, I use AI to save time and don’t have room to ponder over the result.”
Skill loss appears only when someone measures practitioners working without the tool, which almost no deployment evaluation does. In four Polish endoscopy centers, the adenoma detection rate of standard colonoscopies performed by the same doctors fell from 28.4 to 22.4 percent after AI-assisted colonoscopy was introduced, a difference of 6.0 percentage points (95% CI 1.6 to 10.5). The study is retrospective and observational, several authors declare device-manufacturer fees, and its own authors write that continuous exposure “might” reduce detection. The mechanism it points at is older: in a controlled reading experiment, radiologists at every experience level followed a deliberately incorrect AI suggestion, with correct ratings falling from about 80 percent to between 20 and 46 percent, and the least experienced readers were the most captured.
One study on this subject circulates more than the rest. The MIT Media Lab EEG study of essay writing with a language model reports lower brain connectivity and worse recall of one’s own writing among tool users, on 54 participants with 18 completing the final session. It is a preprint, its authors say so and ask that the conclusions be treated as preliminary, and a published comment raises five methodological concerns. It circulates as evidence of brain damage, though what it reports is a small unreviewed study of undergraduates writing essays.
AI scribes and their funders
Ambient AI scribes listen to an encounter and draft the note. The independent evidence is real but modest. The strongest design, a five-site study of 8,581 clinicians, found 13 fewer minutes of record time and 16 fewer minutes of documentation per day, with no change in after-hours work. Vendor-affiliated studies report much larger drops in burnout, and disclose their ties. At least one independent study found documentation burden fell while self-reported burnout rose, and another found AI scribes saved less time than human scribes. Speech recognition also has its own bias: word error rates are higher for Black speakers than for white speakers. Before a partner adopts one, the question to ask of every glowing number is who funded the study that produced it.
Fidelity monitoring and worker monitoring
The same capability that scores a counselor for training scores a worker for management. Systems that analyze recorded sessions can detect a counselor’s reflections at 93 percent recall against human coders and run on thousands of real recordings for supervising new therapists. The founders of the company behind that research disclose in their own papers that they hold equity in it, which is a clean example of a conflict statement to find and read. The other edge is labor: in May 2026, hotline workers at the National Abortion Federation struck for 24 hours and won contract protections against unilateral AI implementation, citing surveillance of both staff and patients.
Decision support and practitioner judgment
A tool that recommends a decision changes how the practitioner decides. Automation bias is the tendency to over-trust the recommendation, and it appears in this field: on real child-abuse hotline screening, senior workers deviated from the algorithm’s score far more than junior workers did, whose decisions tracked it closely. Over-reliance can also erode skill. When endoscopists who had grown used to an AI detection tool then worked without it, their detection rate fell from 28.4 to 22.4 percent, a controlled result that names the risk directly. Alerts that fire too often are also ignored: drug-safety alerts are overridden in 49 to 96 percent of cases, often because most of them were not clinically appropriate to begin with.
Who answers for the decision
Current US federal policy requires a human in the loop for high-impact AI. The 2025 OMB memorandum on federal AI use, M-25-21, requires human oversight and a route to appeal an AI-enabled decision; it replaced an earlier memo, so cite the current one. The social work profession’s own rules predate the AI wave: the NASW, ASWB, CSWE, and CSWA technology standards require that information gathered electronically be reliable and accurate, which applies to an AI-drafted note, and set rules for who may access a client’s electronic record.
Limits
The design of this literature is weaker than its volume suggests. The burnout evidence is almost entirely cross-sectional, so it cannot establish that a system caused anything. There is no validated measure of documentation burden. In the one study that tracked real departures rather than stated intentions, the association reversed.
Some questions have not been measured at all in any study located. There is no throughput or time-to-service evaluation of caseload management software in US child welfare or public benefits, no time-and-motion study of a case management system implementation in US social work, and no evaluation of whether the post-2016 federal child welfare system regulation reduced burden relative to the one it replaced.
Use in the assignments
Run Side A on the system, and A7 in particular: what did it replace, and what was lost in the replacement. Where the deployment is mandated, which is common on this side, Side M is the set that applies. For the Technology Strategy Pitch, the cost section feeds directly into the budget.